Overview
The Shipping Dashboard enables you to monitor shipping costs and volume by carrier, helping you identify trends, control costs, and optimize shipping methods. FBA shipping costs are also included as soon as they become available through the settlement reports.
Shipping Dashboard
To access and use the Shipping Dashboard:
- Go to Reports > Shipping > Shipping Dashboard.
- Click Custom Filter at the top right to filter the dashboard by Company, Company Groups, Channel, or Custom Date Range. You can also set the date range by clicking one of the predefined time frames (e.g., Yesterday, Past 7 Days) at the top left of the page, as well as sort the results by carrier or method. These options control what is displayed on all sections of the dashboard.
The dashboard is comprised of the panels described in the sections below.
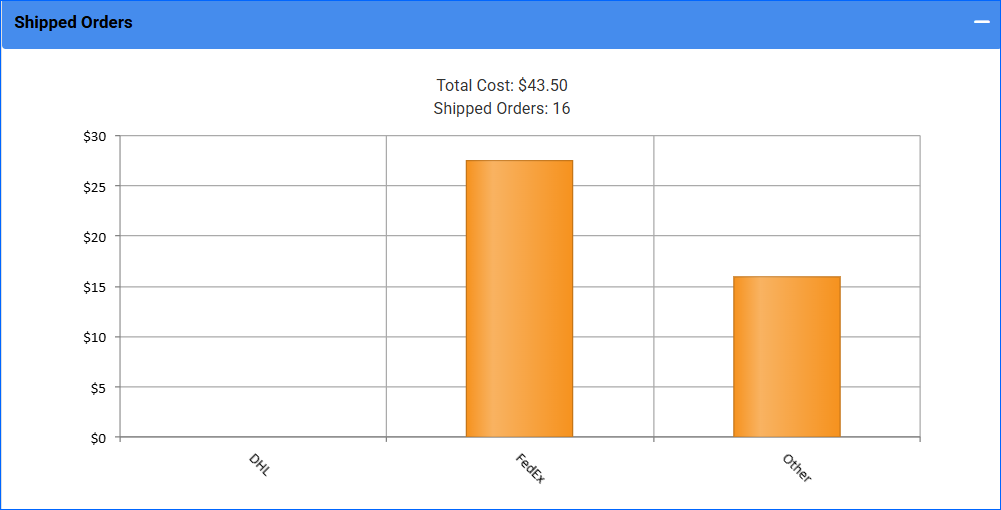
Shipped Orders
This panel shows all shipped orders based on your selected filters. The total cost and total number of shipped orders are displayed above the chart. The bars represent costs associated with different shipping carriers (or methods, depending on your sorting choice). The exact amounts are shown when you hover over each bar.
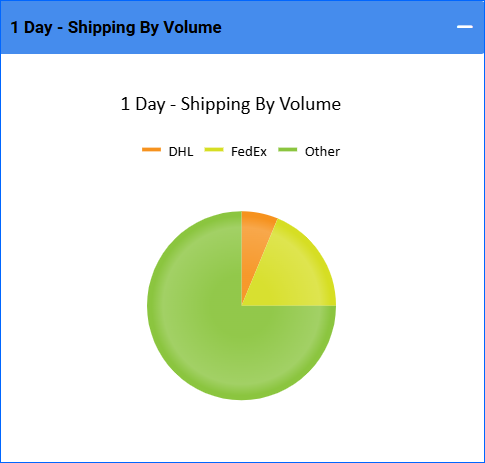
Shipping By Volume
This panel shows the total percentage of shipped orders by volume. The exact percentages and amounts are shown when you hover over each section of the pie chart.
