Overview
The Fulfillment Dashboard allows you to monitor and analyze your orders based on their fulfillment time through several color-coded graphs and charts that give you a visual snapshot of your performance. It displays the total quantity of fulfilled orders for any selected time range and breaks them down into 3 types:
- Early – Shipped before the Promise Date.
- On-Time – Shipped on the Promise Date.
- Late – Shipped after the Promise Date.
You can also identify which of your products are most often the first or last to arrive at your customers’ doorstep and make informed decisions about your fulfillment processes to improve customer satisfaction and quality of service.
Fulfillment Dashboard
To access and use the Fulfillment Dashboard:
- Go to Reports > Shipping > Fulfillment Dashboard.
- Click Custom Filter at the top right to filter the dashboard by Company, Company Groups, Channel, or Custom Date Range. You can also set the date range by clicking one of the predefined time ranges (Yesterday, Past 7 Days, etc.) at the top left of the page. These options control what is displayed on all sections of the dashboard.

- The dashboard is comprised of the panels described in the following sections.
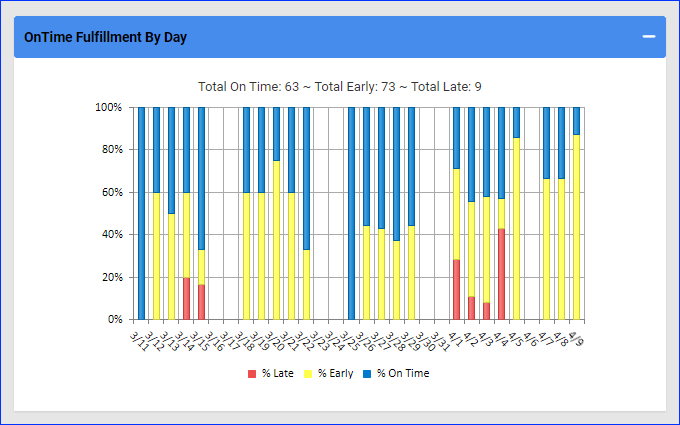
OnTime Fulfillment By Day
This panel shows on-time fulfillment statistics per day:
- The total number of orders shipped On Time, Early, and Late during your selected date range will appear above the bar graph.
- The percentage of orders shipped On Time, Early, and Late per day for each day during your specified date range will appear in the graph. Hover over the graph to see the percentage value.
You can interact with the report:
- To hide or show orders from the graph, click on % Late, % Early, or % On Time below the graph.
- To view the actual orders, click the On Time, Early, or Late parts of a day in the graph.
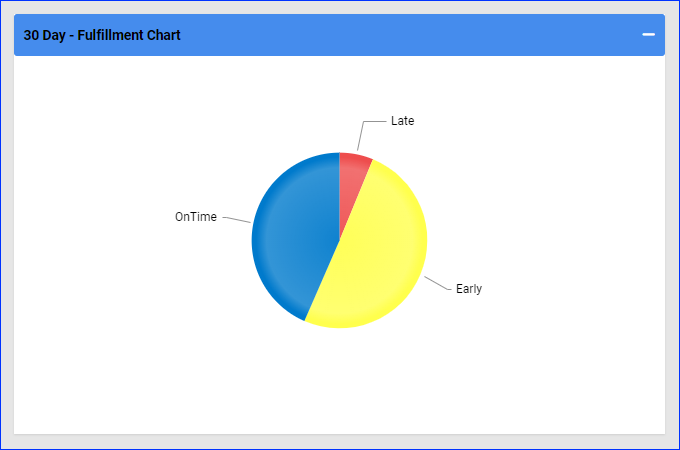
Fulfillment Chart
This panel shows the total amount and percentage of orders shipped On Time, Early, and Late during the selected date range.
- Hover over a section of the pie chart to display the amount and percentage of orders.
- Click a section of the pie chart to view the actual list of orders.
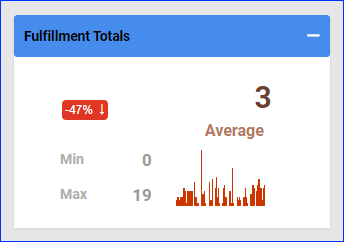
Fulfillment Totals
This panel shows:
- The Minimum, Maximum, and Average number of order fulfillments during the selected date range.
- The percentage value shows the increase or decrease as compared to the previous equivalent time range.
- Hovering over a day in the bar graph shows the number of orders fulfilled during that day.
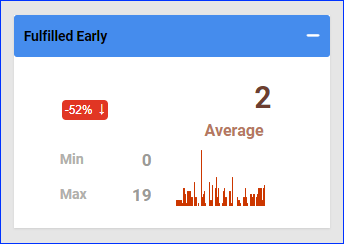
Fulfilled Early
This panel shows:
- The Minimum, Maximum, and Average number of orders that have been shipped early during the selected date range.
- The percentage value shows the increase or decrease as compared to the previous equivalent time range.
- Hovering over a day in the bar graph shows the number of orders fulfilled early during that day.
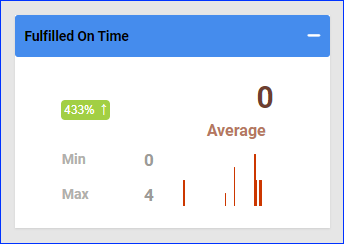
Fulfilled On Time
This panel shows:
- The Minimum, Maximum, and Average number of orders fulfilled on time during the selected date range.
- The percentage value shows the increase or decrease as compared to the previous equivalent time range.
- Hovering over a day in the bar graph shows the number of orders fulfilled on time during that day.
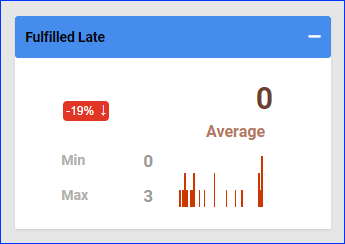
Fulfilled Late
This panel shows:
- Тhe Minimum, Maximum, and Average number of orders fulfilled late during the selected date range.
- The percentage value shows the increase or decrease as compared to the previous equivalent time range.
- Hovering over a day in the bar graph shows the number of orders fulfilled late during that day.
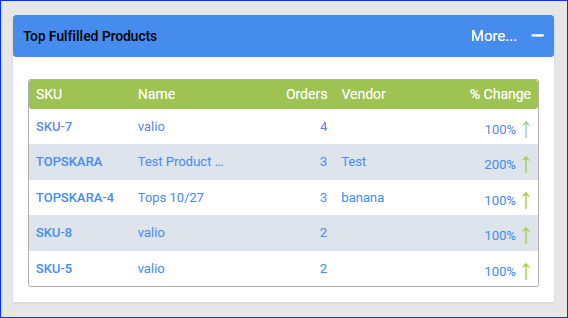
Top Fulfilled Products
This panel shows the top 5 products shipped during your selected date range. You can also see the number of orders and the vendor. The % Change value shows the increase or decrease as compared to the previous equivalent time range.
You can interact with the report:
- Click a SKU to open the Sales Dashboard filtered by that particular product.
- Click More at the panel’s top right corner to open a page with all of the top fulfilled products in your date range, which you can export to Excel.
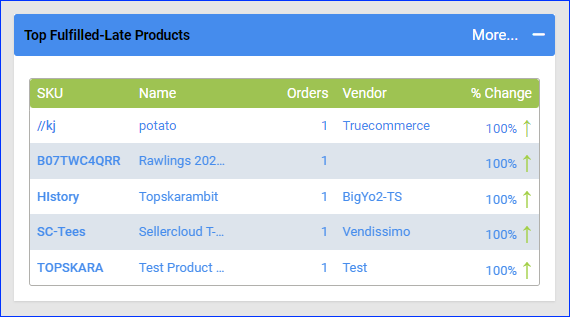
Top Fulfilled-Late Products
This panel shows the top 5 products that were shipped late during a specified date range. You can also see the number of orders and the vendor. The % Change value shows the increase or decrease compared to the previous equivalent time range.
You can interact with the report:
- Click a SKU to open the Sales Dashboard filtered by that particular product.
- Click More at the top right corner to open a page with all of the top late-fulfilled products in your date range, which you can export to Excel.
