Overview
In this article, you will learn about Sellercloud’s Returns Dashboard. This dashboard helps you analyze and monitor returns, refunds, and reimbursements for orders in Sellercloud in a specific time range.
You can filter the dashboard with various options. The filter options control the data displayed on all sections of the dashboard.
You can see the following:
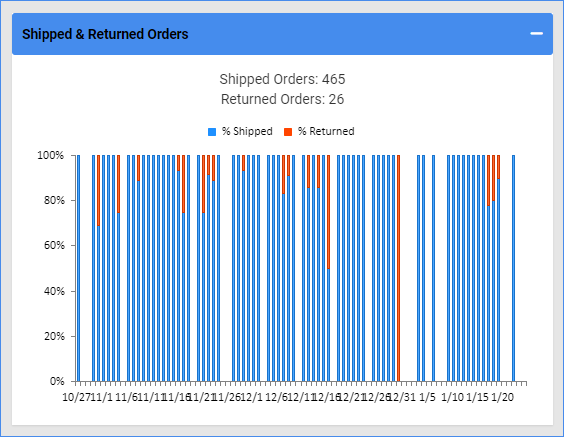
- Numeric and percentage numbers of shipped and returned orders
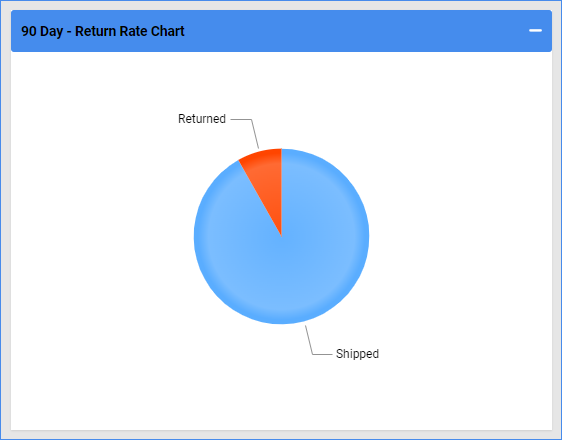
- A return rate pie chart featuring shipped and returned orders
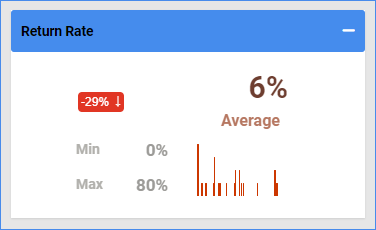
- The minimum, maximum, and average return rate
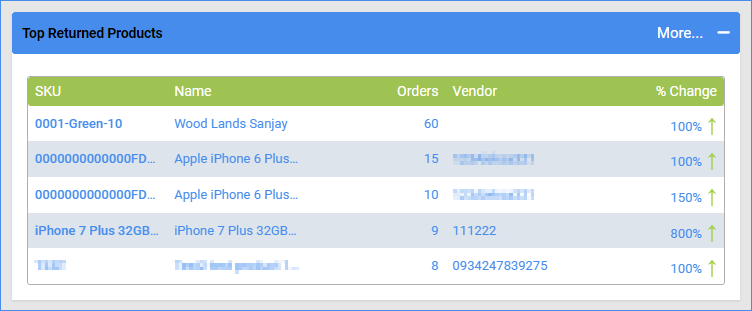
- The top refunded products
Access the Dashboard
To access this dashboard, follow these steps:
- Navigate to Reports > Returns & Refunds> Returns Dashboard.
- Use the options on top to select what the dashboard shows:
- Click the Date Menu on the top left to select a preset date range.
- Click the Left/Right Arrows to go back or forward the same number of days you selected. For example, if you choose Past 7 days on the left, clicking the left arrow will take you seven days back.
- Use the Custom Filter to customize the dashboard further.
Custom Filter
Refer to the list below for descriptions of each filter option:
- Company – Include only returns to one or more companies.
- Company Groups – Include only returns to one or more company groups.
- Channel – Include only returns from one or more sales channels.
- Product Groups – Include only returns of products from one or more product groups.
- Custom Start Date – Show only returns starting from this date.
- Custom End Date – Show only returns up to this date.
Dashboard Data
In this section, you will learn more about each module on the dashboard.
Shipped & Returned Orders
This section provides a daily summary of the number of shipped and returned orders for a selected date range. This information is useful for seeing the volume of returns and identifying any unusual spikes.
Click Shipped or Returned to hide or show shipped or returned orders.
Return Rate Chart
This section presents a pie chart of the return rate, which makes it easy to visualize the overall percentage of shipped orders versus the percentage of returned orders for a specific period.
Click the Returned section of the chart to open the Returns Details report.
Return Rate
This section shows the return rate of products for the selected date range in percentage values. You can see the minimum, maximum, and average return rates for the selected range. It also displays the change compared to a previous time period as a percentage, which allows you to see if the return rate is increasing or decreasing over time.
Top Returned Products
This section lists the top returned products, including the SKU, name, vendor, and percentage change for the selected date range. This information is useful for identifying which products are driving the most returns and understanding the reasons why they are being returned. The percentage change helps to identify trends and understand if a product’s return rate is increasing or decreasing over time.


