Overview
In this article, you will learn about Sellercloud’s Sales Comparison Summary report. It allows you to compare sales from different periods based on the channel, company, manufacturer, product type, or vendor.
The Sales Comparison Detail report is similar, but it compares sales for specific products. It also allows you to generate the report based on additional criteria such as brand, vendor, product group, and SKU.
Access and Customize the Report
To use the Sales Comparison Summary report:
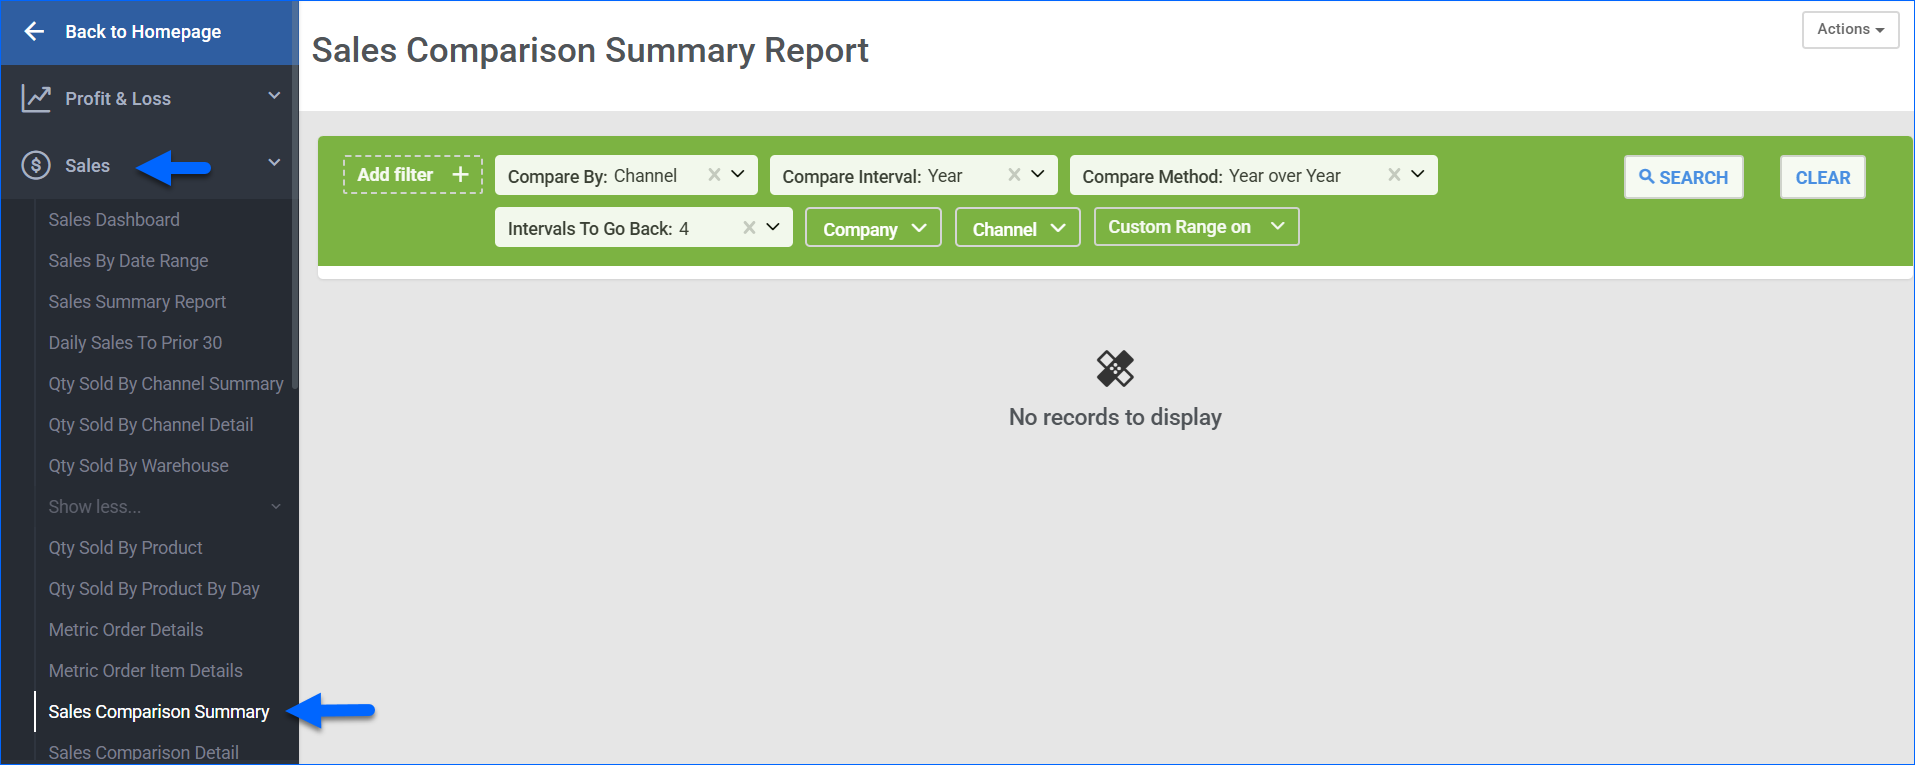
- Go to Reports > Sales > Sales Comparison Summary.
- You can set up the filters according to your preference or use the ones selected by default. For more information, see the Filter Definitions section.
- Click Search. Each filter you apply gets highlighted and displays the selected value.
Filter Definitions
Below is a list of the available filters and their general definitions. Some combinations are incompatible and will not pull any results. Additionally, the section below provides some examples.
- Company – Compare sales from one or more Companies.
- Company Groups – Compare sales from one or more Company Groups.
- Channel – Compare sales from one or more Channels.
- Compare By – Base the sales comparison on the selected option: Company, Channel, Manufacturer, Product Type, or Vendor. For example, selecting Channel will compile and group sales data per sales company.
- Compare Method – Select how to compare intervals:
- Year over Year
- Quarter over Quarter
- Month over Month
- Week over Week (from Sunday to Sunday)
- Compare Interval – Show sales totals from specific time intervals. For example, selecting Year will total the sales data per year, while Quarter will total the data per quarter. The Custom Dates option allows you to use the Custom Range on filter to select specific From and To dates for the interval you want to investigate.
- Custom Range on – Only use this when the Compare Interval is set to Custom Dates.
- Intervals To Go Back – Select how many intervals back you want to compare. You can go back over 53 intervals.
- Display Comparison Indicators – Select Percentage and/or Dollars to change the information available in the graph tooltips.
Example Combinations
Below are some examples of how you can customize the report results to view and compare specific sales information.
Example 1
You can combine the Company and Channel filters to compare sale totals for specific accounts. For example, if you have multiple Amazon accounts, only selecting the Channel: Amazon filter and value will combine the sales from all the accounts. However, if you add a specific company, you will only see sales from the selected one. Additionally, if you have 2 US and several international accounts, this combination allows you to compare just your domestic data or only international sales.
Example 2
The Sales Comparison Summary report allows you to compare the current Month or Quarter sales each year. If you select Compare Interval: Month and Compare Method: Year Over Year, you will see the sales performance of the current month in each year.
Example 3
You can view and compare sales data for a specific date throughout the years. For example, if you have a regular promotion that happens on the same weekend every year, select:
- Compare Interval: Custom Dates
- Custom Range on: the dates of your promotion
- Compare Method: Year Over Year
- Intervals To Go Back: up to 53
This combination will show you the total sales made during your promotion dates for each year. Similarly, you can view specific dates throughout months or quarters.
Incompatible Filters
Some filters in the report are incompatible. Usually, this is the case when your selection in the Compare Method filter is shorter than the Compare Interval. For example, you can’t compare quarter over quarter when your interval is a year.
The following filter combinations are incompatible and will not be available to be selected together:
- Compare Interval set to Year and Compare Method set to:
- Quarter over Quarter
- Month over Month
- Week over Week
- Compare Interval set to Quarter and Compare Method set to:
- Month over Month
- Week over Week
- Compare Interval set to Week and Compare Method set to:
- Quarter over Quarter
- Month over Month
- Compare Interval set to Month and Compare Method set to Week over Week.
- Compare Interval set to Custom Dates and Compare Method set to Quarter over Quarter.
Report Data
The report data is based on the selected filters. It is available as a graph, a results grid, and an export in Excel, CSV, and PDF formats. Each one provides specific insights into the same data. Refer to the sections below for more information. The example report seen in the screenshots goes back 4 intervals, Year Over Year, and has the following filters:
- Compare Interval: Year
- Compare By: Channel
- Channels: Amazon, Wholesale
- Comparison Indicators: $ and % Change
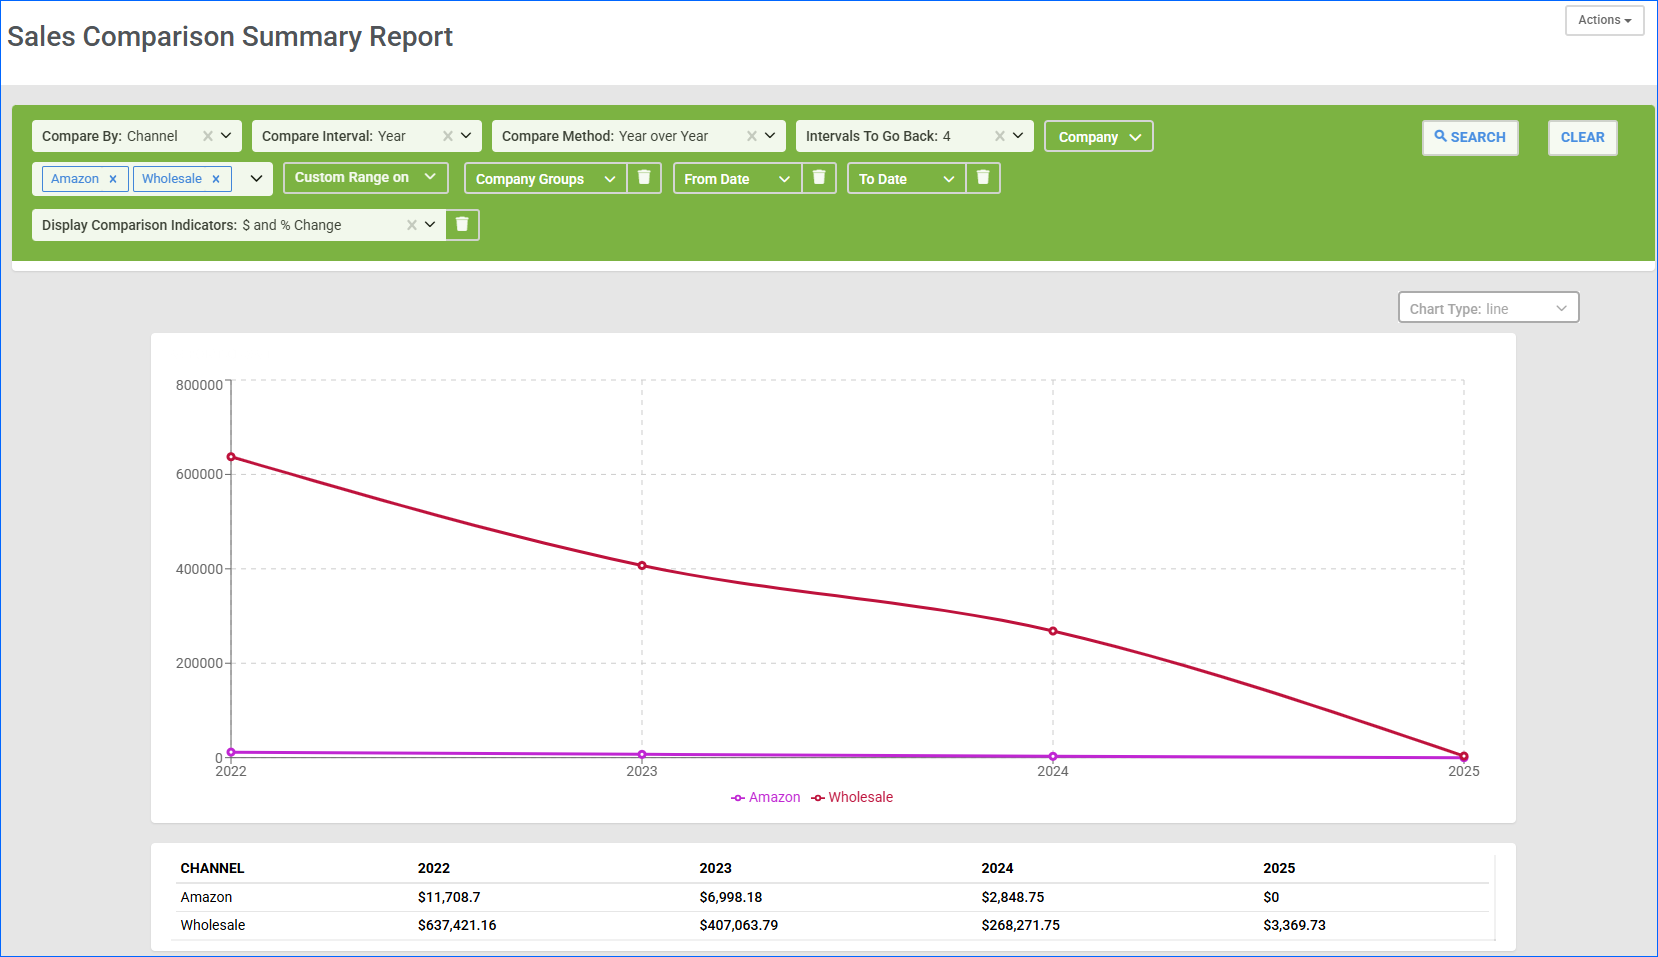
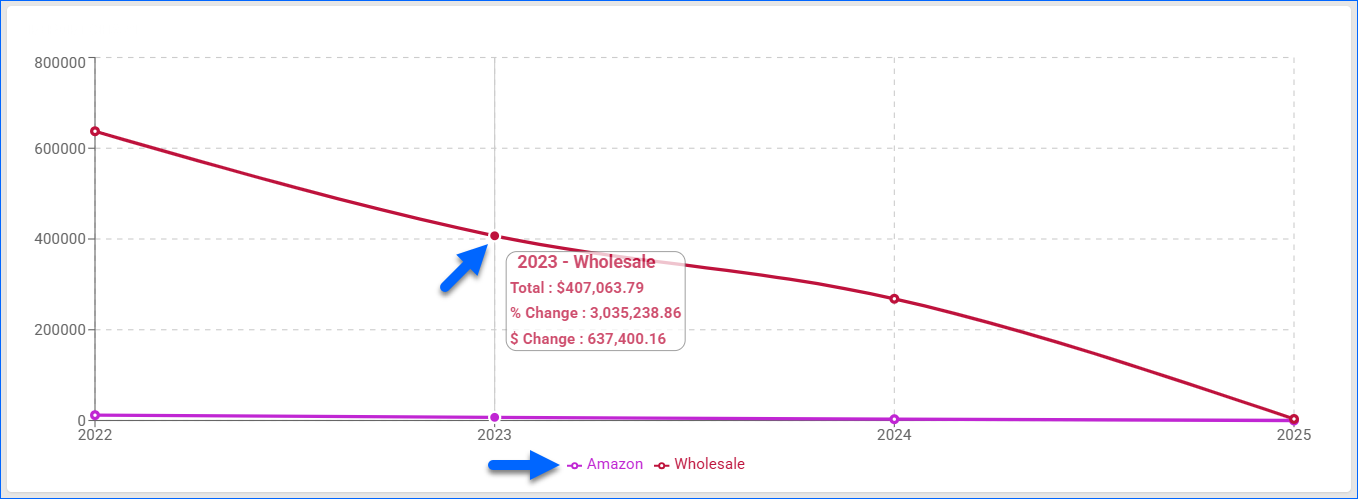
Report Graphs
The Sales Comparison Summary report offers two data visualization options: Bar Chart and Line Chart. You can toggle between them by selecting options in the Chart Type dropdown. The graphs are based on the filters you have selected and display additional information, such as dollar and percentage change of the totals from each interval. The visualization also allows you to easily compare not just performance across intervals but also the performance of different operators (e.g., channels or companies) within one interval.
If you are comparing multiple operators from the Compare By filter (e.g., multiple channels), you can click on the operator name below the graph to exclude it from the visualization.
- Bar Chart – hover over a bar to view the total sale amount and the percentage and/or dollar change for the selected operation and interval.
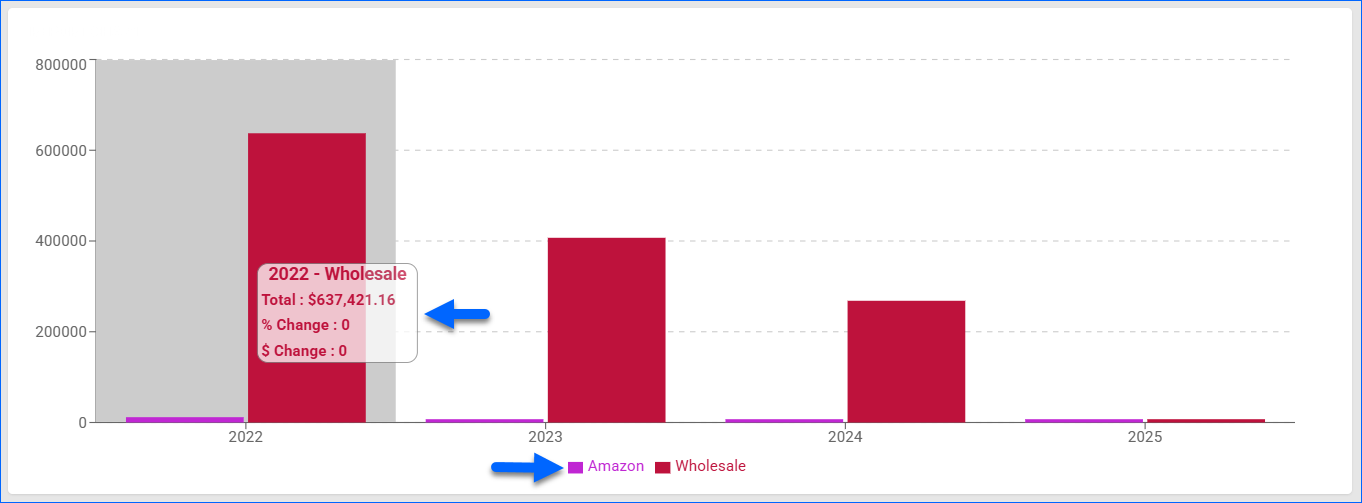
- Line Chart – hover over the dot where the operator name crosses the interval line to view the total sale amount and the percentage and/or dollar change for the selected operation and interval.
Report Grid
The report grid is based on the selected filters. The column headers are the compare intervals (year, quarter, month, week, dates), and the Intervals To Go Back determine the number of columns. The rows are based on which and how many comparison operators you have selected in the Compare By, Channel, and Company filters.
The grid shows the total dollar amount of sales for each interval. Clicking on a value opens a new tab to the Sales By Date Range report with the relevant filters pre-selected. Click search to view a breakdown of orders within the range.

Export Data
To export a Sales Comparison Summary report:
- Configure your filters.
- Click Search to load the results.
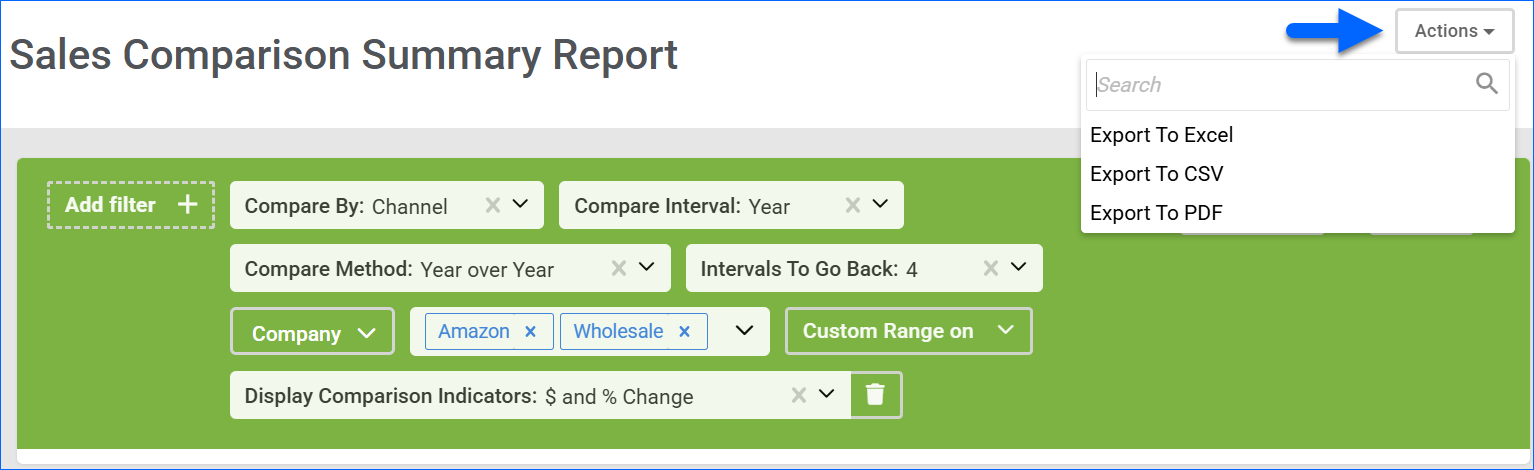
- Click Actions in the top right corner and select:
- Export To Excel
- Export To CSV
- Export To PDF
- The file will download to your device.
The export will contain a combination of Grid and Graph information. The first column is the comparison operator (Channel, Company, etc.), and the second is the operator’s ID. Subsequent columns are based on the selected filters. You will see the total dollar amount for each interval, as well as the percentage and/or dollar change from the previous one.