Overview
In this article, you will learn about Sellercloud’s Inventory by Warehouse Detail report. This report shows the total inventory and value of each of your products per warehouse for a specific period. You can see inventory information from today, as of a specific date, or for each day in a selected date range. It also shows general and purchasing-related product details. The report shows:
- Product Details: Name, SKU, UPC, ASIN, Company, Status, Product Type, Location Notes, Shadow Of, Manufacturer, Vendor, and Purchaser.
- Inventory: Total Inventory and Inventory Per Warehouse.
- Financial Details: Cost Type, Cost, and Value.
For key points about Sellercloud’s Inventory reports, see the Inventory Value Reports Overview.
Access and Customize the Report
To use the report:
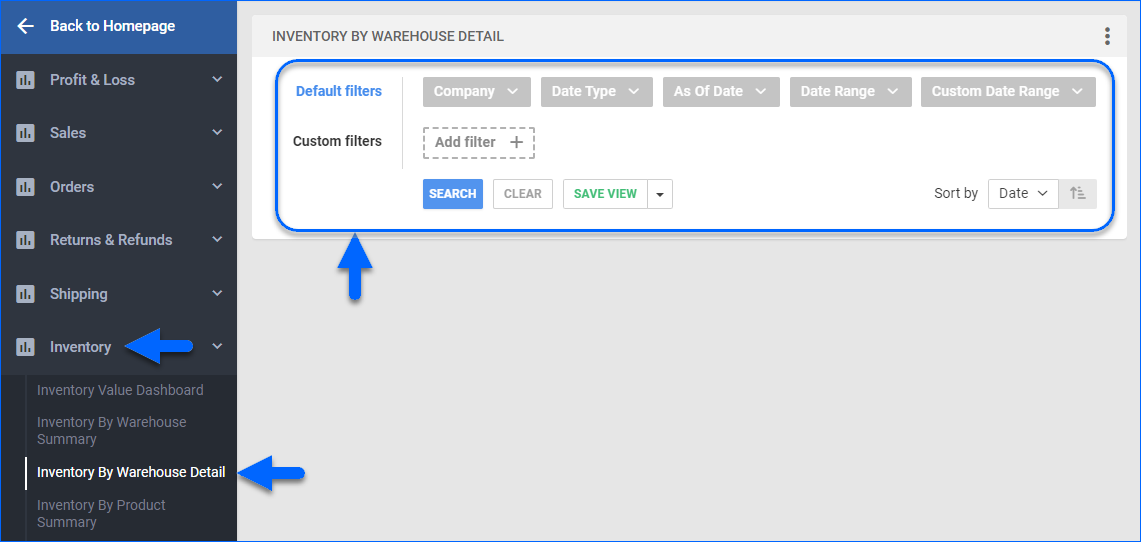
- Go to Reports > Inventory > Inventory By Warehouse Detail.
- Select your date filters, starting with the Date Type. See the Default Filter descriptions for more information.
- Set up the other Default or Custom filters for the report to show precisely what you need.
- Click Search. Each filter you apply gets highlighted in orange, and after you click Search, it turns green. If a filter is gray or not displayed at all, it’s not active.
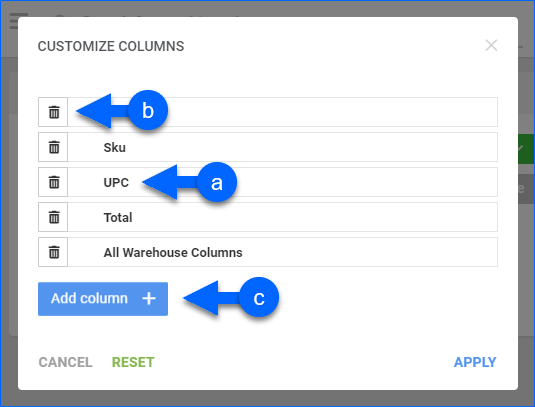
- To manage the columns in the report, click the three dots icon on the top right and select Customize Columns. You can:
- Reorder columns by dragging them up or down in the list;
- Hide columns by clicking the Trash icons;
- Add columns by clicking Add column.
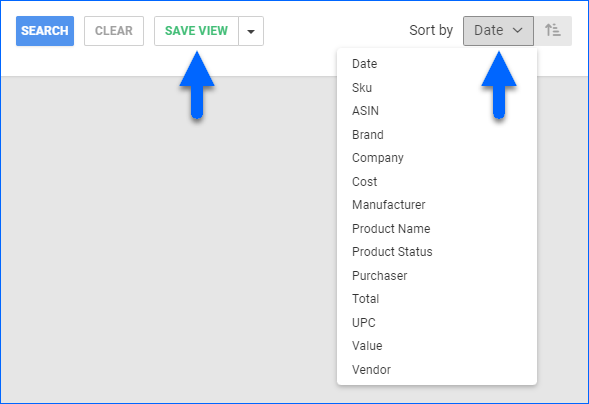
- To sort the data differently, use the Sort by menu.
- To save your filtering and sorting options, click Save view, type a Name, and click Save.
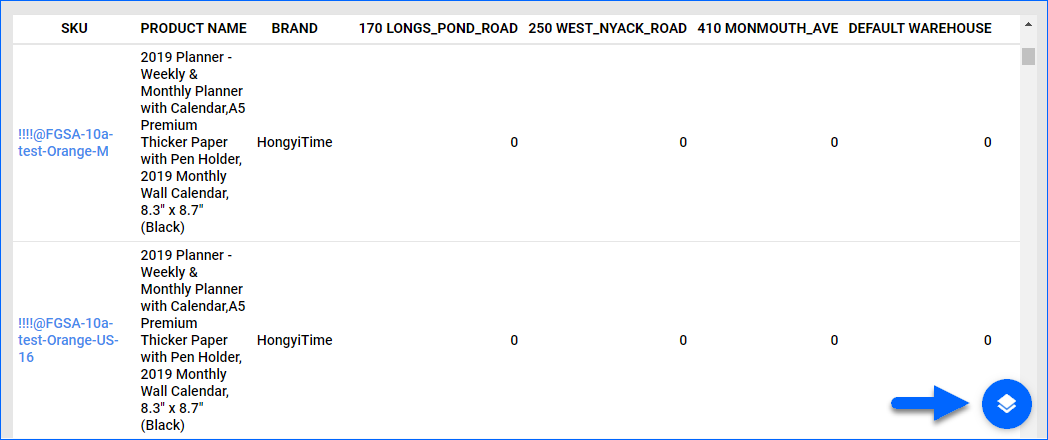
- To export the full report to a spreadsheet, click Actions on the bottom right and select Export to Excel. You can also export to CSV or PDF. Spreadsheet exports always contain all columns, including those hidden in the report.
Filter Definitions
Default Filters
| FILTER | DESCRIPTION |
| Company | Include only inventory information from one or more Companies. |
| Date Type | Select from As of Date, Date Range, and Real Time:
|
| As Of Date | Specify the date you want to see inventory. Applicable when using As of Date as the Date Type. |
| Date Range | Select a preset time range from Yesterday to Last Year. Applicable when using Date Range as the Date Type. |
| Date | Enter the Start and End dates. Applicable when using Date Range as the Date Type. |
Custom Filters
| FILTER | DESCRIPTION |
| Brand | Include only inventory of products from one or more Brands. |
| Company Groups | Include only inventory of products belonging to a specific Company Group. |
| Do Not Include Inventory from Dropship Warehouses | Include or exclude inventory information from Dropship Warehouses. |
| Do Not Include Products with Zero Inventory | Exclude products without inventory from the report. |
| Exclude Negative Inventory in Totals | Exclude products with negative inventory from quantity calculations. |
| Group Products by Parent SKU | By default, Shadow Product inventory is displayed separately per shadow SKU. By setting this filter to Yes, you can group and include shadow inventory in the inventory of the parent SKUs. |
| Manufacturer | Include only inventory of products from specific Manufacturers. |
| Product Groups | Include only inventory of products from specific Product Groups. |
| Product Status | Include only inventory of products that have Active or Inactive statuses. |
| Purchaser | Include only inventory of products with specific users assigned as Purchasers. |
| SKU | Include only the inventory of specific SKUs. |
| Vendor | Include only the inventory of products that have their Default Vendor set to any of the selected. For Dropship orders, this will be the vendor from which the products were purchased. |
| Warehouses | Include only inventory from specific warehouses. |
Report Data
| COLUMN | FIELD DATA | DESCRIPTION |
| Date | Date | Shows the date for which inventory is calculated. Only appears when you filter by Date Range or Custom Date Range. |
| SKU | ProductID | Shows the product’s SKU. Click to open its Product Details Page. |
| UPC | UPC | Shows the product’s Universal Product Code (UPC). |
| Total Inventory | Sum of Total Qty | Shows the product’s total physical inventory across all warehouses. |
| All Warehouse Columns | Total Qty | Shows the product’s physical inventory per warehouse. |
| ASIN | ASIN | Shows the product’s Amazon Standard Identification Number (ASIN). |
| Brand | Brand | Shows the product’s Brand. |
| Company | Company Name | Shows the name of the product’s Company. |
| Cost | Product Cost | Shows the Product Cost per unit. The Client Setting Order Profit & Loss Calculated Using lets you choose whether to calculate your product cost by Average Cost, Site Cost, or Last Cost. For more information, go to Order Item Cost Calculation. |
| Manufacturer | Manufacturer | Shows the product’s Manufacturer. |
| On Order | OnOrder | Shows the number of units that are currently unreceived on open POs. |
| Product Name | ProductName | Shows the product’s name. |
You can add columns listed with an asterisk (*) to the grid by following the instructions outlined in step 5 of the Access and Customize the Report section.