Overview
Predictive purchasing helps you forecast the order quantity for a predicted number of future sales. The projection is based on several factors, including the number of past sales and the currently available quantity. Past sales are used to determine the velocity or the rate of sales per day over a given date range. Velocity is then multiplied to calculate the deficit supply for multiple date ranges. In more complex cases, days in stock and on-order quantities are also factored into the prediction.
Key Terms and Settings
| TERM | DEFINITION |
| Days OF Order | Days of past sales on which you are basing the prediction. This generates a daily velocity. Days with no stock availability are skipped in the Days OF Order Count.
Days with no stock are only skipped when the client setting Use InStock days in predictive purchasing data is enabled.
|
| Days TO Order | Days to which you are multiplying the daily velocity to generate an Add to PO Qty. While the deficit supply will be calculated for all dates, this selection enables a quick add to PO. See below. |
| Velocity | Rate of sales per day when calculated by Qty Sold in Days OF Order divided by Days OF Order. |
| Deficit Supply | Predicted deficit to your supply for multiple date ranges calculated as (Velocity * Days TO Order) – (Available Quantity + On Order). |
Example: Days of Order 30, Days to Order 15.
In this example, 108 units were sold in the past 30 days (Qty Sold column). Since it is based on a 30-day period, the daily sales velocity is 3.6.
- Deficit Supply 15 — Multiplying 3.6 by 15 = 54. Subtract available qty of 28 to get a Deficit 15 of 26. ((108/30) * 15) – 28 = 26
- Deficit Supply30 — Multiplying 3.6 by 30 = 108. Subtract available qty of 28 to get a Deficit 30 of 80 ((108/30) * 30) – 28 = 80
- Deficit Supply 45 —Multiplying 3.6 by 45 = 162. Subtract the available quantity of 28 to get a Deficit 45 of 134. ((108/30) * 45) – 28 = 134
- The same calculation is for 60 and 90; see below for an explanation of 11/M.
Since Days To Order 15 was selected, the deficit qty of 26 was auto-entered into the Qty field to add to a PO.
Vendor Lead Time
You can add another parameter called Vendor Lead Time to the calculation. The Vendor Lead Time is the time it takes for a vendor to ship a purchase order to you.
Enabling this feature changes the Deficit Supply calculation:
- Deficit Supply = (Velocity * (Days TO Order + Vendor Lead Time)) – (Available Quantity + On Order).
Exclude Channels From Predictive Purchasing
To exclude channels from predictive purchasing:
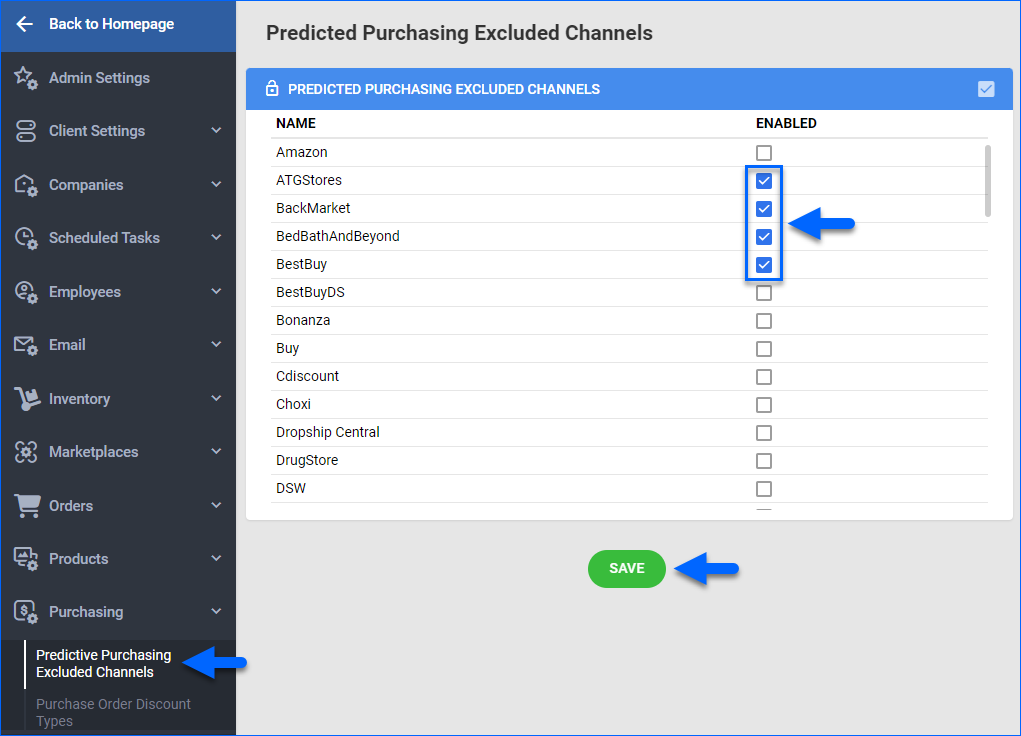
- Go to Settings.
- Select Purchasing > Predicted Purchasing Excluded Channels.
- Check Enabled for channels you want to exclude from the predicted purchasing report and click Save.
Generate a Purchase Prediction
Purchasing predictions are generated automatically when the client setting Calculate Qty Sold in X days for Predicted Purchasing is enabled. This client setting is enabled by default.
To generate a Purchase Prediction:
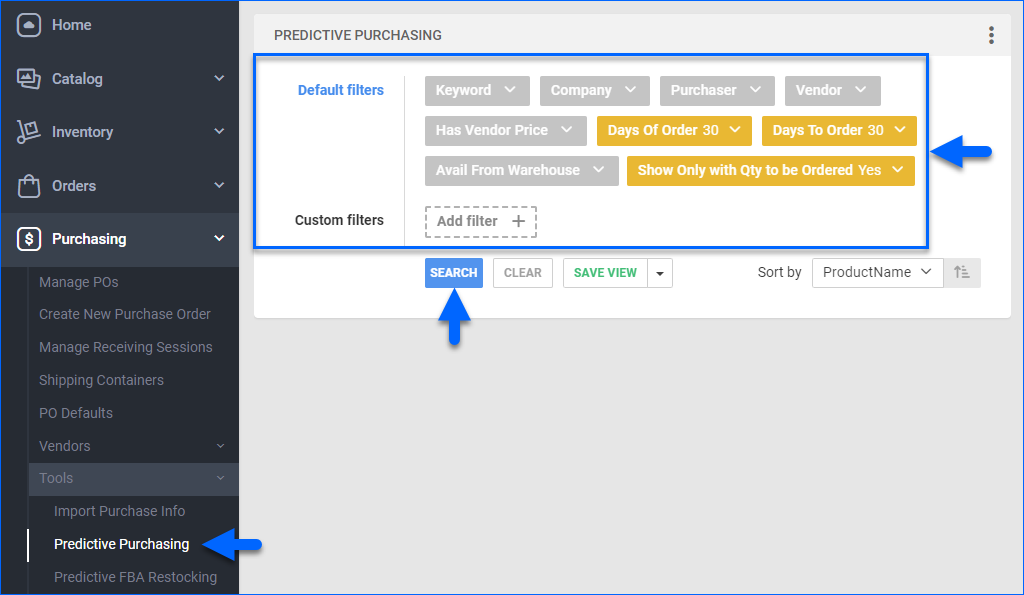
- Go to Purchasing > Tools > Predictive Purchasing.
- Select the Days Of Order / Days To Order from their respective default filter dropdowns.
- Select Yes from the Show Only with Qty Ordered default filter.
- Click Search to populate the grid with items with the columns from the accordion below.
- Refer to the Filters and Columns section below for descriptions of all filters and columns on this page.
If the settings or services were not properly configured or if any client settings were changed since the last time the Predictive Purchase data was calculated, please follow these steps to re-calculate this data:
- Go to Purchasing > Tools > Predictive Purchasing.
- If the services above have been set, go to Step #3 above.
If not, or if you want to calculate based on even more recent data, open the Action menu and choose Generate Data for Sold Since Last Year > Go. This will calculate data for all products in your catalog. Alternatively, you can select specific items on the grid and choose Generate Data for Selected SKUs from the Action menu. SKUs will only appear in the grid after Steps 5 and 6 have been completed.
Filters and Columns
The table below lists and defines all default filters.
| FILTER | DEFINITION |
| Keyword | Show only products whose product name includes specific keywords or phrases. |
| Company | Show only products from specific companies. |
| Purchaser | Show only products bought by specific purchasers. |
| Vendor | Show only products from specific vendors. |
| Selected Vendor Only | Set to Yes to search for any product from the vendor selected in the Pricing For Vendor filter. Otherwise, you search only for products with the selected vendor set up as the Default Vendor. |
| Days Of Order | Days of past sales on which you are basing the prediction. This generates a daily velocity. Days with no stock availability are skipped in the Days OF Order count when the Client Setting Use InStock days in predictive purchasing data is enabled. |
| Days To Order | Days to which you are multiplying the daily velocity to generate an Add to PO Qty. While the deficit supply will be calculated for all dates, this selection enables a quick add to PO. |
| Avail From Warehouse | Show available inventory only for specific Warehouses. |
| Show Only with Qty to be Ordered | Show only products with quantity to be ordered. |
The table below lists and defines all custom filters.
| CUSTOM FILTER | DEFINITION |
| Available Local Qty Range | Search for products that have local available quantity within a specified range. |
| Brand | Show only products from a specific brand. |
| Days Until Depletion From | Set a From date to show only products whose depletion is within a specific date range. |
| Days Until Depletion To | Set a To date to show only products whose depletion is within a specific date range. |
| Default Vendor | Show only products that have a specific default vendor assigned. |
| Exclude Dependent Kits | When enabled, All Component and Main Component Kits will not be displayed in the results grid, but they will still be included in the calculation. |
| Exclude Independent Kits | Exclude Independent Kits from being displayed. However, the calculation will still take them into account. |
| Exclude OnOrder Qty | Exclude product quantities that are currently on order from the calculation. |
| Exclude Ship From Vendor Products | Exclude all products with the setting DropShip Mode set to Ship From Vendor on their Shipping Preferences page. |
| Ignore quantity from non-sellable warehouses | Only consider sellable inventory in the calculation. |
| Manufacturer | Show only products from specific manufacturers. |
| Pricing For Vendor | Show a specific vendor’s price in the Vendor Price column. |
| Product Group | Show only products from specific product groups. |
| Product ID | Show only specific SKUs. |
| Product Type | Show only products from specific product types. |
| Ship From Warehouse | Show only quantities shipped from specific Ship From Warehouses. This requires the Client Setting Enable Predictive Restocking Based On Ship From Warehouse. |
| Show Profit by Kit Component | Show profit broken down by kit components. |
| Velocity Range | Show only products within a specific Velocity range. |
When the results grid loads and you select specific SKUs that have a number larger than 0 in the Qty column, the bottom of the page will display the Total Cost of the selected products multiplied by the quantity.
Additionally, if these SKUs have a CBM Per Unit (Cubic Meters) configured in the Purchasing Tab of their Properties page, the Predictive Purchasing Report will also display the Total CBM of the selected rows. This functionality is available when the Display Additional CBM and Weight Information Client Setting is enabled.
The table below lists and defines some commonly-used columns.
| COLUMN | DEFINITION |
| ProductID | The product SKU. |
| ProductName | The product name. |
| ASIN | Amazon Standard Identification Number |
| Avail. Local Qty | Quantity in all warehouses. |
| Qty To Order | Automatically populated. You can update this field manually by:
|
| Velocity | Rate of sales per day. Calculated as Qty Sold in Days of Order divided by Days of Order. |
| Qty Sold | Quantity sold in the selected Days of Order. Based on the Client Setting above, sales will be calculated for the days the inventory was available. This means that if there were days within the selected Days of Order when there was no available inventory, those days would be skipped in the count. |
| Deficit Supply | The predicted deficit to your supply. This is calculated as follows: (Velocity x Days To Order) – (Available quantity + On Order). |
| 11 Mo | Quantity Sold in a given month for 11 months back. This can be helpful when trying to determine quantities to order for seasonal periods, which are often different than those preceding non-season months. For example, if you are at the beginning of November and want to determine how much to order for the coming seasonal month of December, this column will look back 11 months – to December – and display the quantity sold for the month of December. This can be used as an indicator if you need to order more quantity than was the quantity calculated based on the regular velocity. |
| On Order | Shows how many units are on open Purchase Orders. PO must be set as “Approved” to consider quantity “On Order.” It is critical for determining if a product needs to be ordered and, if so, how many units to purchase. After determining how many units are needed for the given time period, both the available quantity and OnOrder quantities are factored in to determine how many need to be ordered. Clicking the OnOrder Quantity will open the related PO. |
| Vendor | Default vendor for the product. |
| Vendor Price | Price for the default vendor. |
| Amazon BuyBox Price | Retail price of Amazon’s BuyBox. Many online sellers use this information to determine if they can be competitive on a given product or if they should discontinue the product. Read how to get the Amazon BuyBox. |
Add Items to PO
To create a PO from the Predictive Purchasing report:
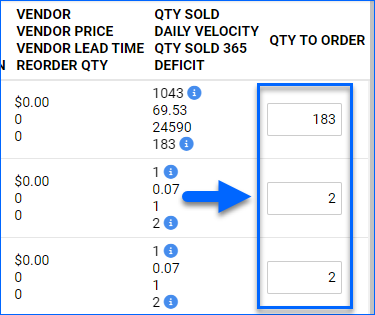
- A deficit quantity based on the Days To Order selection will auto-populate in the Qty To Order field. Edit the field as necessary.
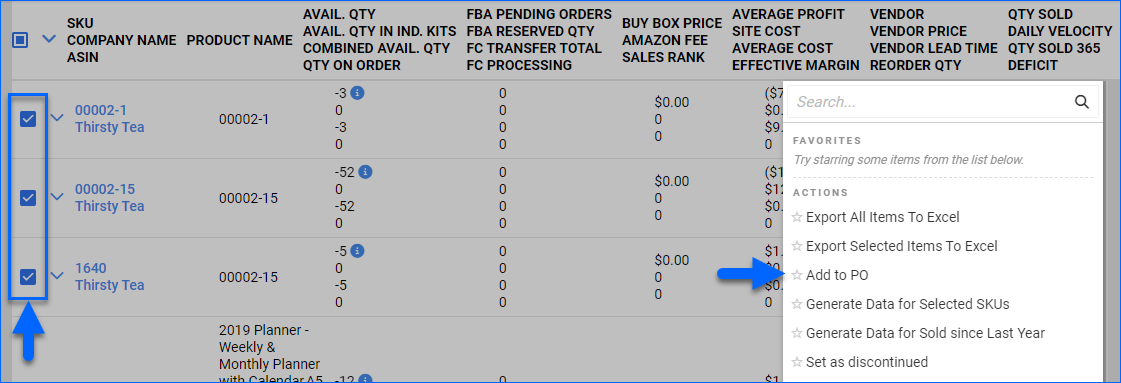
- Select the products on the grid.
- Click the Actions icon and select Add to PO.
- The Add Products to PO will open:
- The first step will show you a grid of the selected products, where you can make final quantity adjustments. Additionally, at the bottom of the grid, you will see the total Cost and CBM (Cubic Meters) for all the products multiplied by the number of units.
The CBM per Unit and Total CBM columns become visible when the Client Setting Display Additional CBM and Weight Information is enabled.
- Then, you will be prompted to either create a new PO or add to an existing one. Choose your option and click Next.
- Based on your selection in the previous step, select a PO or configure the Vendor, Company, and Case Qty Mode for your new Purchase Order.

- The first step will show you a grid of the selected products, where you can make final quantity adjustments. Additionally, at the bottom of the grid, you will see the total Cost and CBM (Cubic Meters) for all the products multiplied by the number of units.
- Click Add to finalize.
Export a Predictive Purchase Report
You can create a scheduled task that automatically exports a predictive purchasing Excel file. You can save the file for future reference and documentation. This report will track a variety of information, like Site Cost or Average Profit.
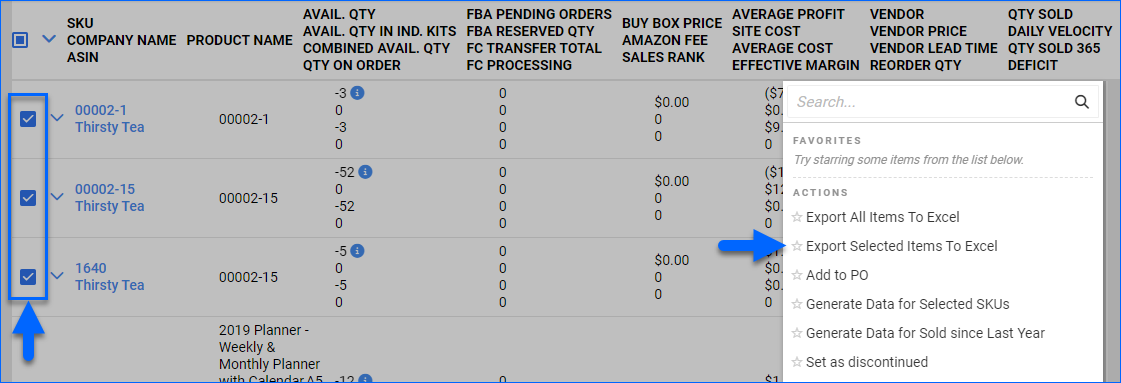
To export a Predictive Purchase report:
- Go to Purchasing > Predictive Purchasing.
- Search and select specific items.
- Click the Actions icon and select Export Selected Items to Excel.
Enhanced Predictive Purchasing
You can enable an enhanced version of the report to add more features.
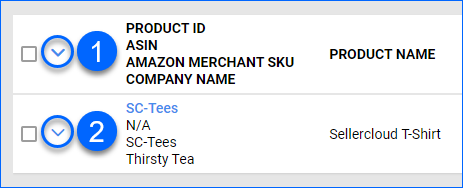
The enhanced version has a new column and a Level 2 that you can expand per line or for all items simultaneously to see the new features.
To show or hide Level 2, click:
- (1) The Down Arrow next to the column headers on top for all items.
- (2) The Down Arrow next to each row for a single item.
Sales Graph
The Sales Graph shows the daily sales for the last 365 days. You can see the following:
- Orders – The number of orders for each day.
- Trendline – The sales trend over time.
- Averages – The average sales Velocity for different Days OF Order periods. To hide lines, click the colored squares.
- Last Year – The selected Days OF Order time period during the previous year is highlighted in yellow.
Velocities Chart
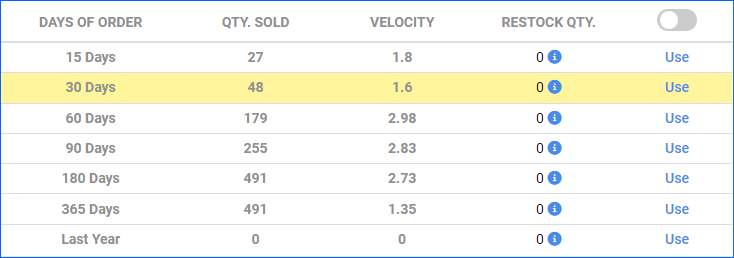
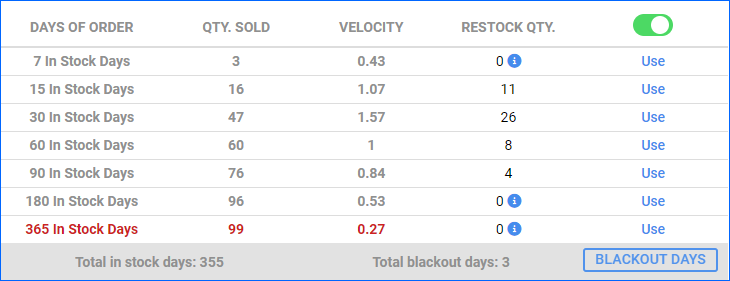
The Velocities Chart shows the Quantity Sold, Sales Velocity, and Restock Quantity for multiple Days OF Order periods. The period you initially selected when generating the report will be highlighted in yellow. To apply the Restock Quantity for another period, click Use, and it will populate in Level 1 of the report.
You can switch the Days OF Order type between In Stock Days and Calendar Days with the toggle button. The default type comes from the Client Setting Use InStock days in predictive purchasing data. For In Stock Days below 365, the font will be red, indicating a projected velocity that is not entirely based on the actual sales history.
If you choose to show the Calendar Days, you will also see the Last Year row, which gets the data for the selected Days OF Order starting from today’s date on the previous year. For example, if you set the Days OF Order to 30 on July 9th, it will check the 30 days after July 9th of the previous year.
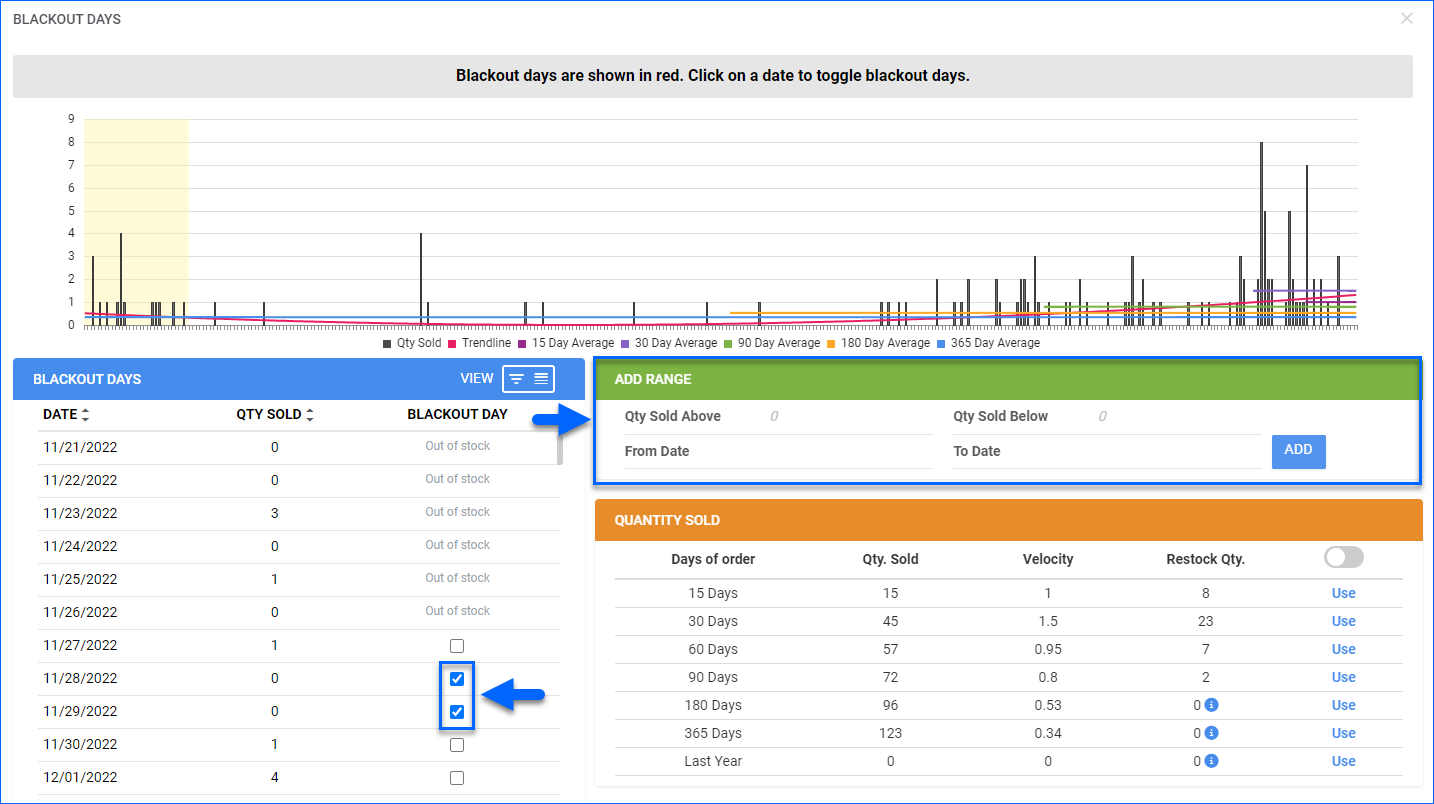
If you show the In Stock Days, you can click the Blackout Days button next to the Sales Graph to open the blackout days window.
Blackout Days
The Blackout Days feature allows you to exclude specific days, entire date ranges, or sale quantities above or below specific numbers from the calculation. For example, if there was a sales spike or no sales, you can exclude these days so they don’t skew your restocking numbers incorrectly. Blackout days are shown in red in the Sales Graph.
- In the Blackout Days grid, you can check the box under the Blackout Day column to exclude any day from the calculation.
- In the Add Range grid, you can specify a From Date and To Date to exclude a whole date range or enter a Qty Sold Above and/or Qty Sold Below to exclude specific sale quantities.
- The Last Year period is highlighted in yellow.
Overview
Predictive purchasing helps you forecast the order quantity for a predicted number of future sales. The projection is based on several factors, including the number of past sales and the current available quantity. Past sales are used to determine the velocity or the rate of sales per day over a given date range. Velocity is then multiplied to calculate the deficit supply for multiple date ranges. In more complex cases, days in stock and on-order quantities are also factored into the prediction.
Key Terms and Settings
| TERM | DEFINITION |
| Days OF Order | Days of past sales on which you are basing the prediction. This generates a daily velocity. Days with no stock availability are skipped in the Days OF Order Count.
Days with no stock are only skipped when the client setting Use InStock days in predictive purchasing data is enabled.
|
| Days TO Order | Days to which you are multiplying the daily velocity to generate an Add to PO Qty. While the deficit supply will be calculated for all dates, this selection enables a quick add to PO. See below. |
| Velocity | Rate of sales per day when calculated by Qty Sold in Days OF Order divided by Days OF Order. |
| Deficit Supply | Predicted deficit to your supply for multiple date ranges calculated as (Velocity * Days TO Order) – (Available quantity + On Order). |
Example: Days of Order 30/ Days to Order 15
In this example, 108 units were sold in the past 30 days (Qty Sold column). Since it is based on a 30-day period, the per-day velocity is 3.6.
- Deficit Supply 15 — Multiplying 3.6 by 15 = 54. Subtract available qty of 28 to get a Deficit 15 of 26. ((108/30) * 15) – 28 = 26
- Deficit Supply 30 — Multiplying 3.6 by 30 = 108. Subtract available qty of 28 to get a Deficit 30 of 80 ((108/30) * 30) – 28 = 80
- Deficit Supply 45 —Multiplying 3.6 by 45 = 162. Subtract available qty of 28 to get a Deficit 45 of 134. ((108/30) * 45) – 28 = 134
- The same calculation is for 60 and 90; see below for an explanation of 11/M.
Since Days TO Order 15 was selected, the deficit qty of 26 was auto-entered into the Qty field to add to a PO.
Vendor Lead Time
You can add another parameter called Vendor Lead Time to the calculation. The Vendor Lead Time is the time it takes for a vendor to deliver a purchase order to you.
Enabling this feature changes the Deficit Supply calculation:
- Deficit Supply = (Velocity * (Days TO Order + Vendor Lead Time)) – (Available Quantity + On Order).
Exclude Channels From Predicted Purchasing
To exclude channels from predicted purchasing:
- Go to Settings > Predicted Purchasing Excluded Channels.
- Check Enabled for channels you want to exclude from the predicted purchasing report and click Save.
Generate a Purchase Prediction
Purchasing predictions are generated automatically when the client setting Calculate Qty Sold in X days for Predicted Purchasing is enabled. This client setting is enabled by default.
To generate a Purchase Prediction:
- Go to Inventory > Predicted Purchasing.
- You also have the option to go Inventory > Manage Inventory and search for the SKUs you want to regenerate the data for. Then, from the Action menu, you can select the action Generate Predicted Purchase Data.
- Select the Days Of Order / Days To Order from their respective dropdowns.
- Check Only show rows with quantity to be ordered to see items with deficit quantities only.
- Click Search to populate the grid with items with the columns from the accordion below.
- Review the Filters and Columns section below to understand the search filters and columns on the page.
If the settings or services were not properly configured or if any client settings were changed since the last time the Predictive Purchase data was calculated, please follow these steps to re-calculate this data:
- Go to Purchasing > Tools > Predictive Purchasing.
- If the services above have been set, go to Step #3 above.
If not, or if you want to calculate based on even more recent data, open the Action menu and choose Generate Data for Sold Since Last Year > Go. This will calculate data for all products in your catalog. Alternatively, you can select specific items on the grid and choose Generate Data for Selected SKUs from the Action menu. SKUs will only appear in the grid after Steps 5 and 6 have been completed.
Filters and Columns
The table below lists and defines all default filters.
| FILTER | DEFINITION |
| Keyword | Show only products whose product name includes specific keywords or phrases. |
| Company | Show only products from specific companies. |
| Purchaser | Show only products bought by specific purchasers. |
| Vendor | Show only products from specific vendors. |
| Include Vendor Price items | Check this box to search for any product from the vendor selected in the Pricing For Vendor Name custom filter. Otherwise, you search only for products with the selected vendor set up as the Default Vendor. |
| Days Of Order | Days of past sales on which you are basing the prediction. This generates a daily velocity. Days with no stock availability are skipped in the Days OF Order count when the Client Setting Use InStock days in predictive purchasing data is enabled. |
| Days To Order | Days to which you are multiplying the daily velocity to generate an Add to PO Qty. While the deficit supply will be calculated for all dates, this selection enables a quick add to PO. |
| Avail From Warehouse | Show available inventory only for specific Warehouses. |
| Show Only with Qty to be Ordered | Show only products with quantity to be ordered. |
The table below lists and defines all custom filters.
| CUSTOM FILTER | DEFINITION |
| Brand | Show only products from a specific brand. |
| Days Until Depletion From | Set a From date to show only products whose depletion is within a specific date range. |
| Days Until Depletion To | Set a To date to show only products whose depletion is within a specific date range. |
| Default Vendor | Show only products that have a specific default vendor assigned. |
| Exclude Dependent Kits | Exclude All Component and Main Component Kits. |
| Exclude Independent Kits | Exclude Independent Kits. |
| Exclude OnOrder Qty | Exclude product quantities that are currently on order from the calculation. |
| Exclude Ship From Vendor Products | Exclude all products with the setting DropShip Mode set to Ship From Vendor on their Shipping Preferences page. |
| Ignore quantity from non-sellable warehouses | Only consider sellable inventory in the calculation. |
| Manufacturer | Show only products from specific manufacturers. |
| Pricing For Vendor Name | Show a specific vendor’s price in the Vendor Price column. |
| Product Group | Show only products from specific product groups. |
| Product ID | Show only specific SKUs. |
| Product Type | Show only products from specific product types. |
| Ship From Warehouse | Show only quantities shipped from specific Ship From Warehouses. This requires the Client Setting Enable Predictive Restocking Based On Ship From Warehouse. |
| Show Profit by Kit Component | Show profit broken down by kit components. |
| Velocity Range | Show only products within a specific Velocity range. |
The table below lists and defines all columns.
| COLUMN | DEFINITION |
| ProductID | The product SKU. |
| ProductName | The product name. |
| ASIN | Amazon Standard Identification Number |
| Avail. Local Qty | Quantity in all warehouses. |
| Qty To Order | Automatically populated. You can update this field manually by:
|
| Velocity | Rate of sales per day. Calculated as Qty Sold in Days of Order divided by Days of Order. |
| Qty Sold | Quantity sold in the selected Days of Order. Based on the Client Setting above, sales will be calculated for the days the inventory was available. This means that if there were days within the selected Days of Order when there was no available inventory, those days would be skipped in the count. |
| Deficit Supply | The predicted deficit to your supply. This is calculated as follows: (Velocity x Days To Order) – (Available quantity + On Order). |
| 11 Mo | Quantity Sold in a given month for 11 months back. This can be helpful when trying to determine quantities to order for seasonal periods, which are often different than those preceding non-season months. For example, if you are at the beginning of November and want to determine how much to order for the coming seasonal month of December, this column will look back 11 months – to December – and display the quantity sold for the month of December. This can be used as an indicator if you need to order more than the quantity calculated based on the regular velocity. |
| On Order | Shows how many units are on open Purchase Orders. PO must be set as “Approved” to consider quantity “On Order.” It is critical for determining if a product needs to be ordered and, if so, how many units to purchase. After determining how many units are needed for the given time period, both the available quantity and OnOrder quantities are factored in to determine how many need to be ordered. Clicking the OnOrder Quantity will open the related PO. |
| Vendor | Default vendor for the product. |
| Vendor Price | Price for the default vendor. |
| Amazon BuyBox Price | Retail price of Amazon’s BuyBox. Many online sellers use this information to determine if they can be competitive on a given product or if they should discontinue the product. Read how to get the Amazon BuyBox. |
Add Items to PO
- Deficit quantity based on the Days To Order selection will auto-populate in the QTY field; edit the field as necessary.
- Select the products on the grid.
- Open the Action Menu and choose Add to PO > Go. You will be prompted to create a new PO or add to an existing one.
- Choose your option and click Continue.
Export a Predictive Purchase Report
You can create a scheduled task that automatically exports a predictive purchasing Excel file. You can save the file for future reference and documentation. This report will track a variety of information, like Site Cost or Average Profit.
To export a Predictive Purchase report:
- Click Manage Inventory > Predicted Purchasing > Search > Select the items you want to create a report for.
- Click the Select Action drop down menu > Click Export to Excel > Go.
