Overview
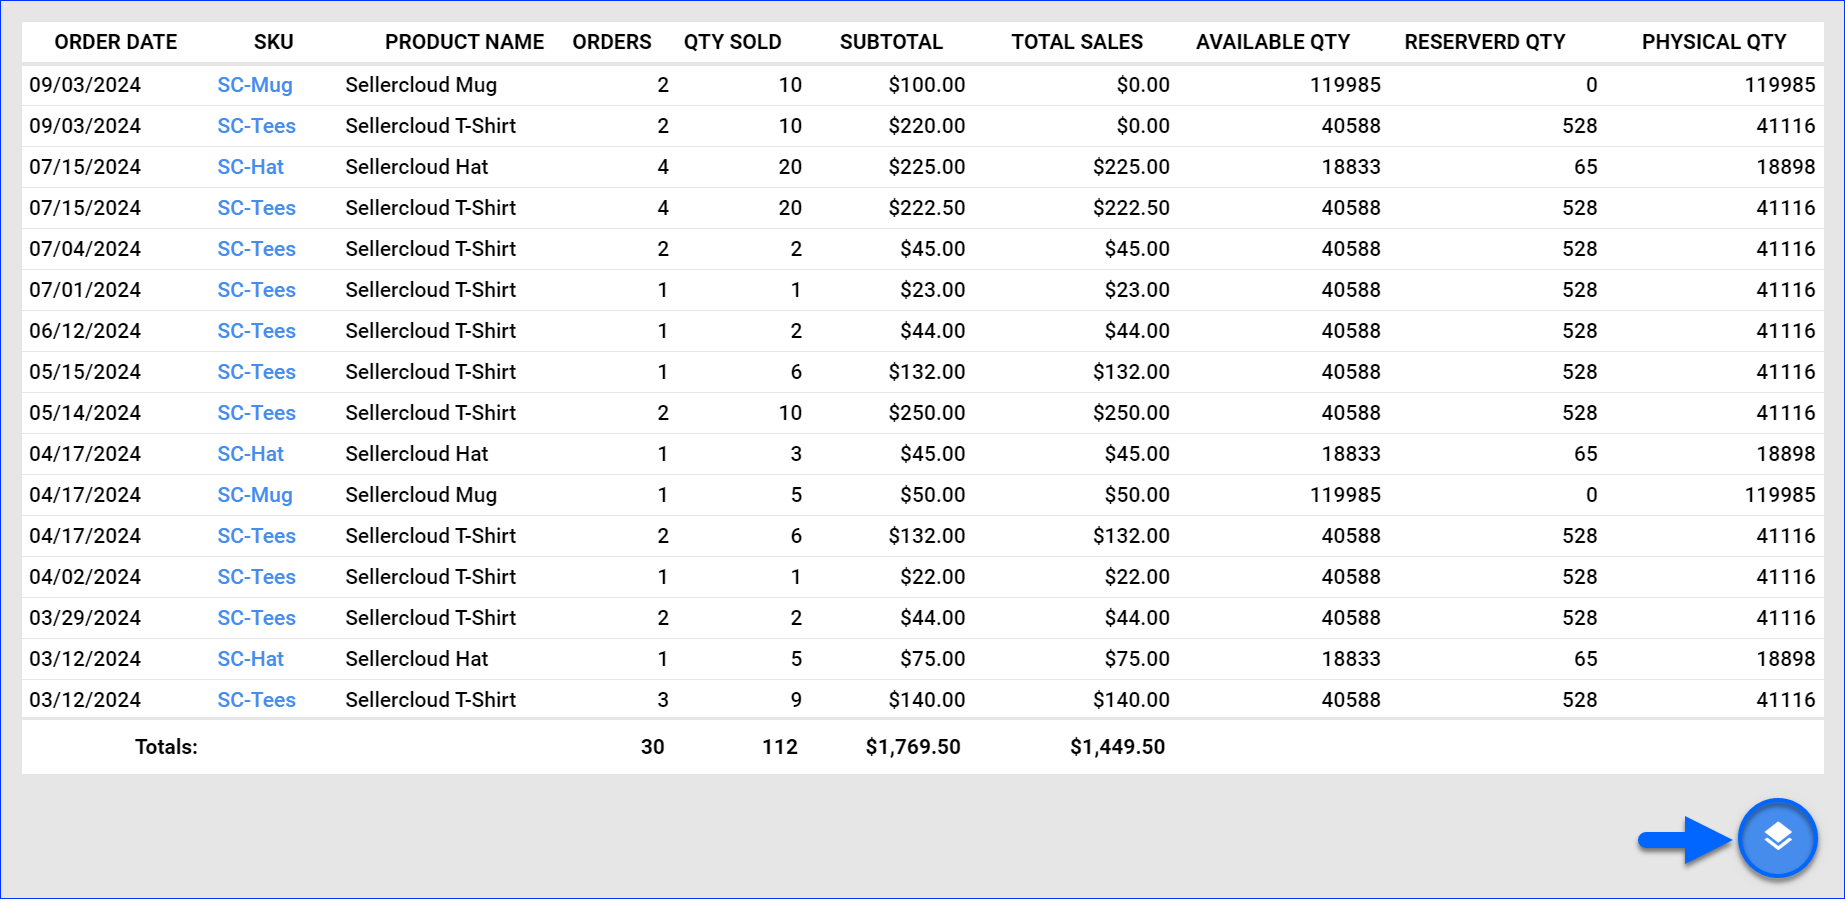
In this article, you will learn about Sellercloud’s Quantity Sold By Product By Day report. This report summarizes the quantity sold by product daily for a specific period. It also includes additional sales information and your current inventory. You can see the following:
- Order and Sales information: Order Date or Ship Date, Orders, Quantity Sold, Subtotal, Additional Charges, Discounts, and Total Sales.
- Inventory information: Available Quantity, Reserved Quantity, and Physical Quantity.
The inventory information in the report always reflects your current inventory at the time of generating the report, regardless of the date range of your search. - Product information: Product Name, SKU, and ASIN.
You can run this report automatically on a regular basis with Scheduled Tasks.
For more information about Sellercloud’s Financial Reporting Suite, see the Reports FAQ.
Access and Customize the Report
To use the report:
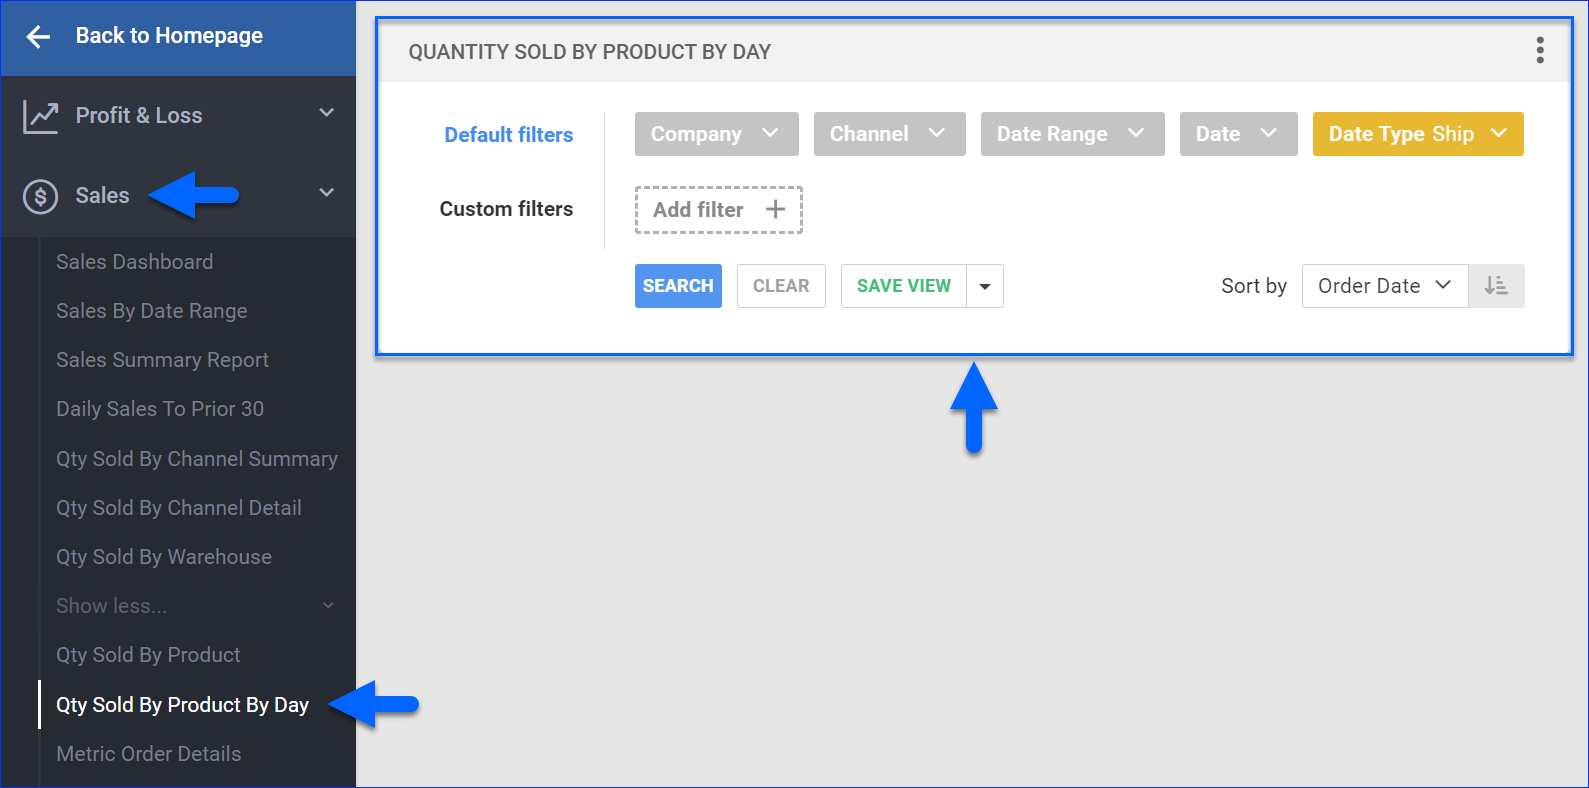
- Go to Reports > Sales > Qty Sold By Product By Day.
- Select your date filters (Date Range or Date), and be sure to choose the right Date Type filter for your search. This filter affects which orders are returned by the search. Select Order to see orders placed in the selected range or Ship to see orders shipped in the selected range.
- Set up the other Default or Custom filters for the report to show precisely what you need.
- Click Search. Each filter you apply gets highlighted in orange, and after you click Search, it turns green. If a filter is gray or not displayed at all, it’s not active.

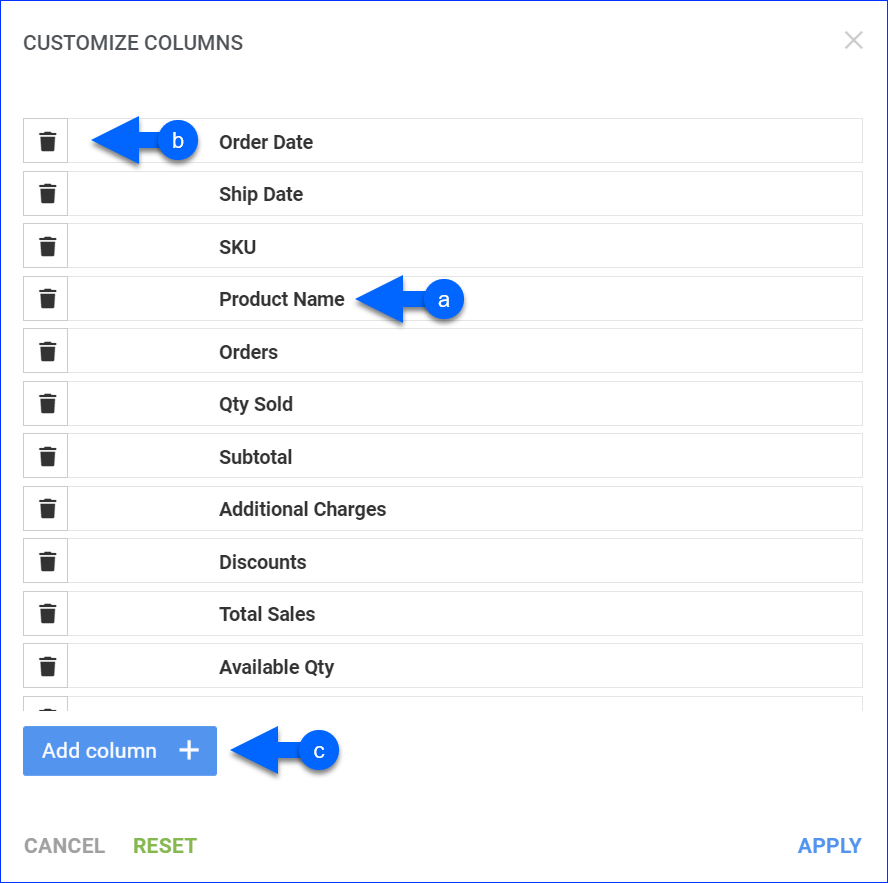
- To manage the columns in the report, click the three dots icon on the top right and select Customize Columns. You can:
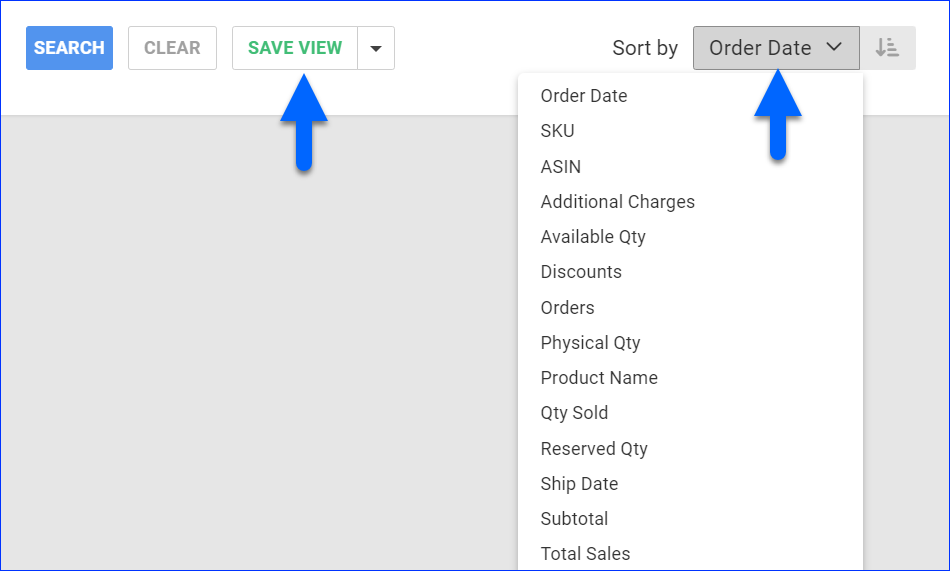
- To sort the data differently, use the Sort by menu.
- To save your filtering and sorting options, click Save view, type a Name, and click Save.

- To export the full report to a spreadsheet, click Actions on the bottom right and select Export to Excel. You can also export to CSV or PDF.

Filter Definitions
Default Filters
| Filter | Description |
| Company | Include only products with sales from one or more Companies. |
| Channel | Include only products with sales from one or more Channels. |
| Date Range | Select a preset date range from Yesterday to Last Year. |
| Date | Enter the Start and End dates. For a single date, choose the same Start and End date. |
| Date Type | Choose a date type to control which product sales activity appears in the report:
|
Custom Filters
| Filter | Description |
| Brands | Include only products from one or more Brands. |
| Company Groups | Include only products with sales from one or more Company Groups. |
| Exclude Dropship | Exclude information about Dropship inventory from the report. |
| Manufacturer | Include only products from one or more Manufacturers. |
| Product Type | Include only products from one or more Product Types. |
| Purchaser | Include only products with a specific user assigned as Purchaser. |
| SKU | Include only one or more SKUs. |
| Show Products By Kit Component SKU | For Kit Products, select Yes to show the kits’ component SKUs. Otherwise, only the kits’ parent SKUs appear by default. This works for all kit types. |
| Use Original Product ID | For Shadow Products, select Yes for the report to show the original shadow SKU under which the item was sold. Select No to see only parent SKUs. |
| Vendor | Include only products that have their Default Vendor set to any of the selected. For Dropship orders, this will be the vendor from which the products were purchased. |
Report Data
| Column | Field Data | Description |
| Order Date | OrderDate | This column appears when you set the Date Type filter to Order and shows the date when orders for the SKU came in. |
| Ship Date | ShipDate | This column appears when you set the Date Type filter to Ship and shows the date when orders for the SKU were shipped. |
| SKU | ProductID | Shows the product’s SKU. For Shadow Products, this column depends on the Use Original ProductID Custom Filter. |
| Product Name | ProductName | Shows the SKU’s product name. |
| Orders | Count of OrderID | Shows the total number of orders. If the Date Type is:
|
| Qty Sold | Sum of Qty | Shows the number of product units sold. If the Date Type is:
|
| Subtotal | Sum of SubTotal | Shows the total amount of the item before any discounts, tax, shipping, etc. |
| Additional Charges | Sum of Shipping, Handling Fee, Gift Wrap Charge, Insurance, and Tax | Shows the total amount of any non-item order charges applied to the order. |
| Discounts | Sum of Discount | Shows the total amount of all discounts applied to the orders. |
| Total Sales | Sum of GrandTotal | Shows the Grand Total of the product: (Subtotal + Additional Charges – Discounts). |
| Available Qty | InventoryAvailableQty | Shows the current number of units available for sale. |
| Reserved Qty | ReservedQty | Shows the current inventory that is Reserved. |
| Physical Qty | ReservedQty + InventoryAvailableQty | Shows the current total inventory of the product across warehouses, including units that are ordered but not shipped yet. |
| *ASIN | ASIN | Shows the product’s Amazon Standard Identification Number (ASIN). |
You can add columns listed with an asterisk (*) to the grid by following the instructions outlined in step 5 of the Access and Customize the Report section.
